


Data rarely lives in a single system.
Organizations often manage information across multiple Excel sheets, databases, HR systems, and ERP platforms. The real challenge lies in bringing these datasets together to create meaningful insights.
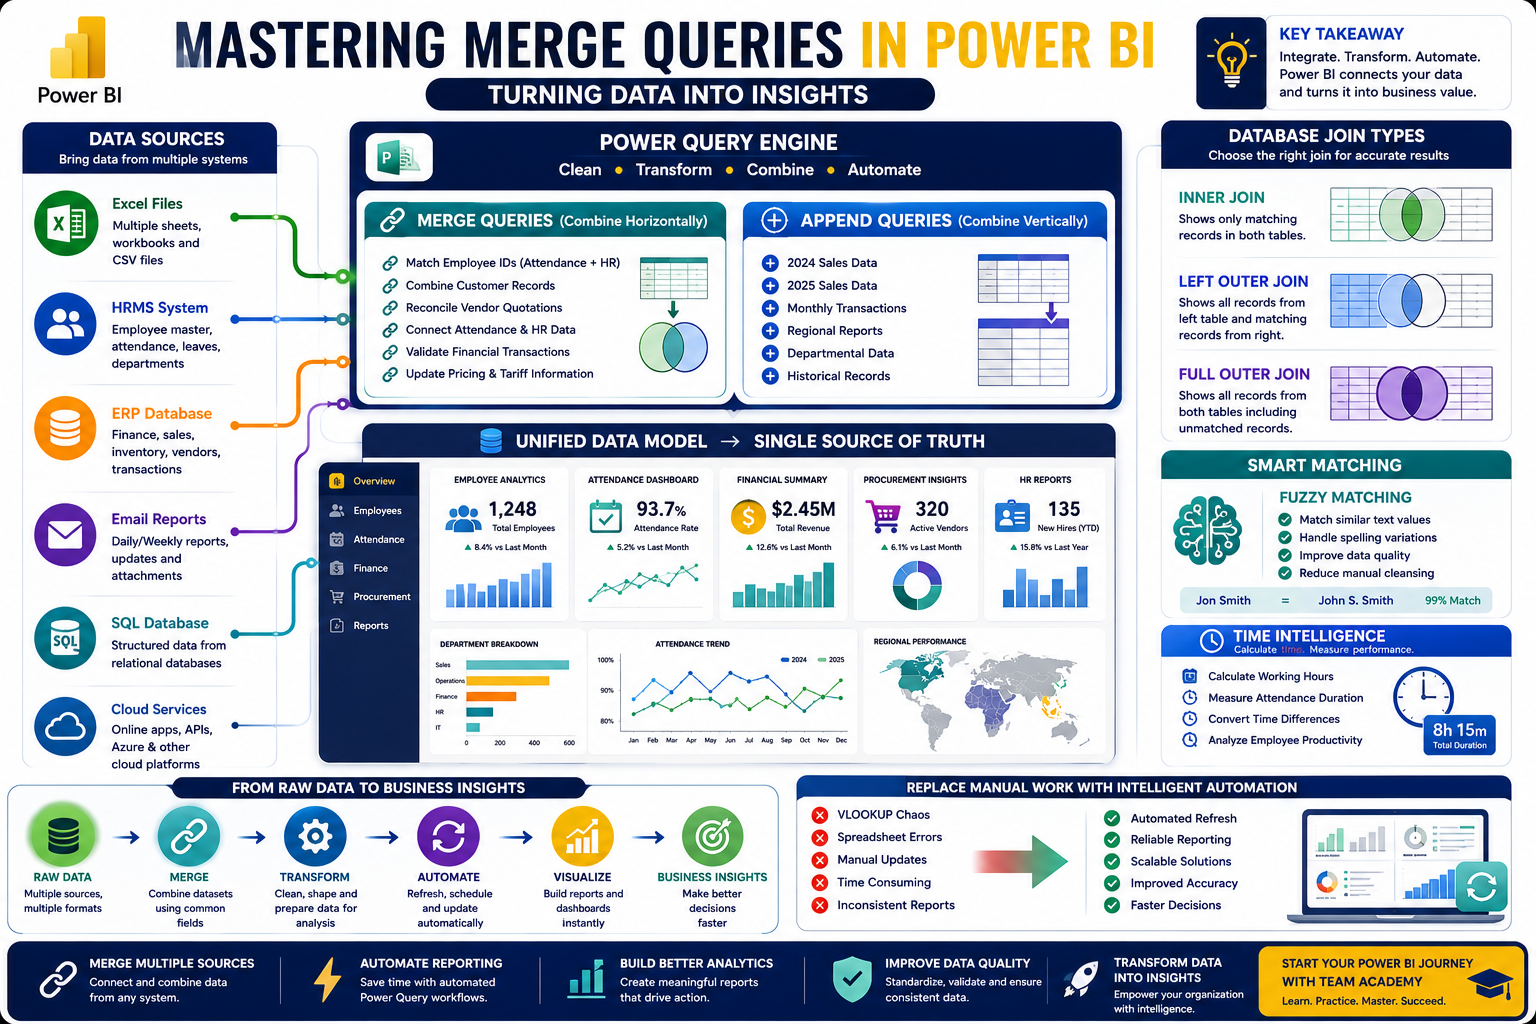
In this Power BI session, participants explored one of the most powerful features of Power Query: Merge Queries. Through practical exercises, learners discovered how to reconcile data from different sources, automate reporting processes, and replace manual Excel formulas with intelligent data transformations.
🚀 Why Merge Queries Matter
Modern businesses frequently encounter scenarios like:
-
Comparing employee attendance with HR records
-
Matching customer data across systems
-
Reconciling vendor quotations
-
Validating financial transactions
-
Updating pricing and tariff information
Without automation, these tasks often rely on manual VLOOKUP formulas and repetitive spreadsheet work.
Merge Queries provide a smarter solution by enabling Power BI to connect and compare datasets automatically.
🔄 Understanding Merge vs Append
One of the first lessons of the session was understanding the difference between two important Power Query operations:
📌 Append Queries
Combines datasets vertically by adding rows together.
Example:
Combining 2024 sales data with 2025 sales data.
🔗 Merge Queries
Combines datasets horizontally using common fields.
Example:
Linking employee attendance records with HR master data using Employee ID.
Understanding when to append and when to merge is a fundamental skill for every Power BI professional.
📊 Exploring Database Join Types
Participants learned several database join techniques used in Power BI and SQL environments.
🔍 Inner Join
Displays only matching records between two tables.
Business Example:
Finding employees who attended events in both 2024 and 2025.
⬅️ Left Outer Join
Displays all records from the left table and matching records from the right table.
Business Example:
Showing all employees in the HR system, even if attendance data is missing.
🌐 Full Outer Join
Displays all records from both tables, including unmatched records.
Although useful in certain scenarios, learners discovered that full outer joins often generate many null values and are used less frequently.
A key takeaway from the session:
Inner Join and Left Outer Join solve nearly 98% of business reporting requirements.
👥 Real-World HR Analytics
One hands-on exercise focused on employee attendance analysis.
Participants merged:
-
Attendance records
-
HRMS employee data
Using Employee ID as the common identifier, learners created a unified dataset capable of supporting workforce analytics.
This exercise demonstrated how organizations can integrate operational and HR data to generate richer business insights.
🧠 Eliminating VLOOKUP with Power Query
For many Excel users, VLOOKUP has long been the go-to solution for data matching.
The session highlighted how Power Query offers a more scalable and automated alternative.
Benefits include:
✅ Automatic updates when source files change
✅ Better handling of large datasets
✅ Reduced formula errors
✅ Improved report reliability
Instead of maintaining complex spreadsheets, analysts can create repeatable processes that refresh with a single click.
🎯 Fuzzy Matching: Handling Imperfect Data
Real-world data is rarely perfect.
Participants explored Fuzzy Matching, a feature that allows Power BI to match similar values even when text differs slightly.
Examples include:
-
Spelling variations
-
Abbreviations
-
Minor formatting differences
However, the session also emphasized caution:
Fuzzy matching works best with text-based fields but may introduce errors when applied to identifiers such as employee IDs or invoice numbers.
Choosing the right matching strategy is essential for maintaining data quality.
⏱️ Working with Time and Duration Calculations
The class also covered time intelligence techniques within Power Query.
Participants learned how to:
-
Calculate working hours
-
Measure attendance duration
-
Convert time differences into numeric values
-
Analyze employee productivity
A simple but important lesson emerged:
Always subtract Time Out from Time In to calculate accurate durations.
These techniques are widely used in HR, operations, and workforce analytics.
📈 Automating Business Processes
The session reinforced Power BI's role in business automation.
Participants practiced creating processes that automatically:
✔ Merge datasets
✔ Calculate values
✔ Apply business rules
✔ Refresh reports when source data changes
This shift from manual spreadsheets to automated reporting enables organizations to make faster and more reliable decisions.
🌐 Beyond Excel: Enterprise Data Integration
The discussion briefly expanded to enterprise systems and cloud platforms.
Participants explored:
-
Azure connectivity
-
Online services
-
Multi-source data integration
As organizations continue their digital transformation journey, the ability to combine data across systems is becoming an increasingly valuable skill.
📚 Homework Assignment: Applying Merge Queries in Business
To reinforce learning, participants were assigned a practical exercise:
Create business scenarios demonstrating the use of:
🔗 Merge Queries
Combining related datasets.
➕ Append Queries
Stacking datasets vertically.
📊 Group By Operations
Summarizing and aggregating data.
This exercise encourages learners to think about how Power BI can solve real organizational challenges.
🚀 Why Data Integration Skills Matter
Organizations today rely on data from multiple systems.
Professionals who can:
📊 Merge complex datasets
🔄 Automate reporting workflows
📈 Build scalable data models
🧠 Improve data quality
⚡ Replace manual spreadsheet processes
are highly valued across industries including finance, HR, procurement, healthcare, and operations.
Power BI is not just a reporting tool—it is a platform for transforming raw data into business intelligence.
🎯 Continue Your Power BI Journey with Team Academy
At Team Academy, learning goes beyond theory and focuses on practical business applications.
Learn How To:
✅ Master Power Query
✅ Build Automated Reports
✅ Merge Multiple Data Sources
✅ Create Professional Dashboards
✅ Deliver Actionable Business Insights
The future of analytics belongs to professionals who can connect, transform, and interpret data effectively.
📩 Join Team Academy and unlock the power of Business Intelligence.


