


Every successful dashboard begins with one critical step: getting the data right.
In the first academic session of Team Academy's Power BI training program, participants were introduced to the foundations of Power Query, the powerful data preparation engine that enables organizations to automate reporting, consolidate information from multiple sources, and build reliable business intelligence solutions.
Rather than focusing on charts and visuals, the session concentrated on the most important stage of any analytics project—data sourcing and transformation.
📊 Why Data Preparation Matters
Many organizations still rely on manual Excel processes that involve:
❌ Copying and pasting data from multiple files
❌ Maintaining hundreds of formulas
❌ Updating reports manually every week
❌ Reconciling inconsistent data sources
While these methods may work initially, they become difficult to manage as data volumes grow.
Participants learned that Power BI is designed to automate these processes and create scalable reporting systems that save time and improve accuracy.
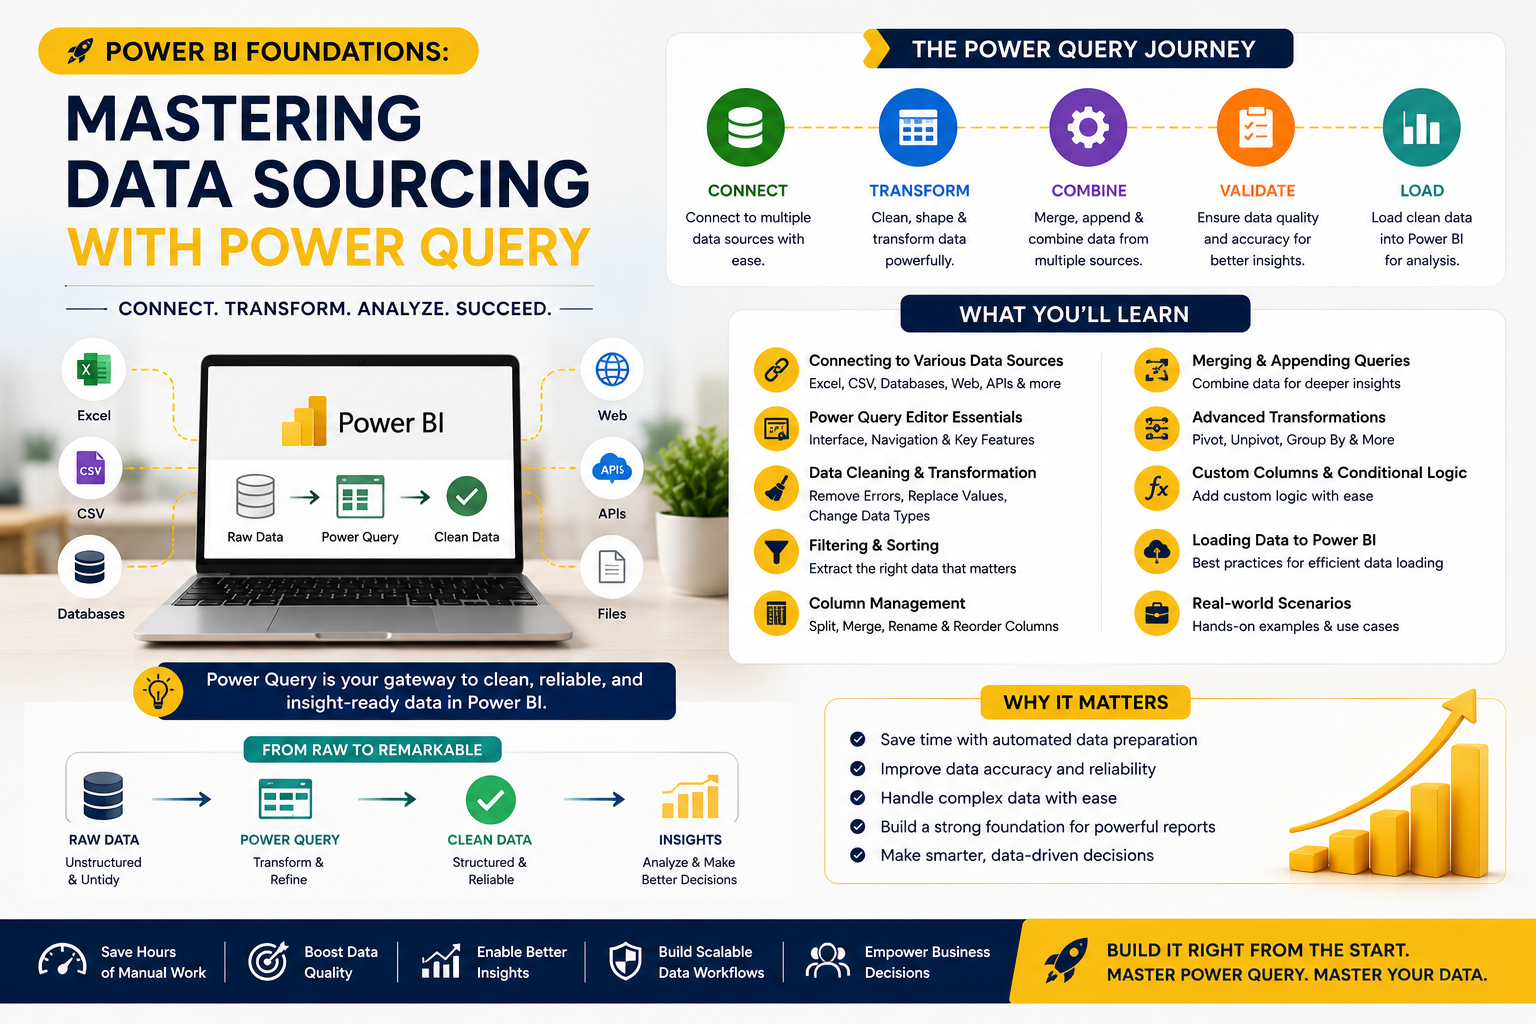
⚡ Understanding Power Query
Power Query serves as the data preparation layer of Power BI.
It allows users to:
✅ Connect to multiple data sources
✅ Clean and transform data
✅ Combine datasets automatically
✅ Validate information quality
✅ Create repeatable reporting processes
The session emphasized that Power Query is one of the most valuable skills for anyone pursuing Business Intelligence, Data Analytics, or Reporting Automation.
📂 Understanding Data Sources
Participants explored the different ways Power BI can retrieve information.
Examples included:
Excel Sheets
Raw worksheet data used for reporting.
Excel Tables
Structured datasets optimized for analysis.
Excel Workbooks
Collections of multiple sheets and tables.
Folder Connections
Automated loading of multiple files from a shared location.
Databases & ERP Systems
Enterprise-grade data sources used for real-time reporting.
A key lesson was understanding when and how to use each source type depending on business requirements.
🔄 Moving Beyond Manual Reporting
One of the most practical discussions focused on replacing manual Excel reporting processes.
Instead of:
-
Copying monthly files
-
Updating formulas
-
Consolidating reports manually
Participants learned how Power Query can:
✔ Automatically read new files from folders
✔ Combine multiple reports instantly
✔ Standardize data structures
✔ Refresh reports with a single click
This automation significantly reduces reporting effort while improving consistency and reliability.
📈 Data Validation & Quality Checks
Strong business intelligence depends on trustworthy data.
The session introduced participants to Power Query's profiling and validation capabilities.
Key metrics explored included:
-
Count
-
Distinct Values
-
Unique Values
-
Empty Records
-
Error Records
-
Minimum Values
-
Maximum Values
-
Average Values
These tools help analysts quickly identify inconsistencies and verify the quality of incoming data before building reports.
🧠 Understanding Data Profiling
Participants were introduced to advanced profiling concepts that help analysts understand datasets more effectively.
Topics included:
Data Distribution
Understanding how values are spread across records.
Column Profiles
Examining data quality and completeness.
Standard Deviation
Measuring variation within data.
Statistical Validation
Identifying anomalies and inconsistencies.
These techniques help organizations build more reliable reporting systems and improve decision-making accuracy.
📑 Combining Multiple Excel Sheets
One of the hands-on exercises focused on a common business challenge:
How do you combine multiple Excel sheets without manually copying and pasting?
Using Power Query, participants learned how to:
-
Connect to multiple worksheets
-
Append datasets together
-
Create a unified reporting table
-
Refresh data automatically when source files change
This approach eliminates repetitive manual work and creates a scalable reporting process.
📁 Automating Folder-Based Reporting
The session also demonstrated how Power BI can connect directly to folders containing multiple files.
Instead of importing files one by one, learners discovered how to:
✅ Connect to an entire folder
✅ Detect new files automatically
✅ Combine matching datasets
✅ Refresh reports instantly
This capability is particularly valuable for organizations managing recurring monthly or weekly reports.
🏗️ Building the Foundation for Future Dashboards
Participants learned that before creating dashboards, KPIs, or visualizations, they must first establish:
✔ Reliable Data Sources
✔ Clean Data Structures
✔ Consistent Business Logic
✔ Automated Refresh Processes
These foundations ensure that future dashboards remain accurate, scalable, and easy to maintain.
📚 What's Coming Next?
The first four classes of the program are dedicated entirely to Power Query mastery.
Upcoming topics include:
📧 Connecting to Outlook Emails
Extracting business information directly from email sources.
📄 Working with PDF Files
Importing and transforming PDF-based reports.
🗄️ Database Connectivity
Connecting Power BI to enterprise systems.
🔄 Advanced Transformations
Cleaning, shaping, and enriching datasets.
These skills will prepare participants for the next phases of the program, including data modeling, DAX calculations, KPIs, and dashboard development.
🎯 Why Power Query Skills Are in Demand
Organizations worldwide are investing in data-driven decision-making.
Professionals who can:
📊 Automate Reporting
📂 Consolidate Multiple Data Sources
⚡ Build Efficient Data Pipelines
🔍 Validate Data Quality
📈 Prepare Data for Analytics
are highly valued across finance, operations, supply chain, healthcare, project management, and business intelligence roles.
Power Query is often the hidden engine behind successful dashboards—and mastering it provides a major competitive advantage.
🚀 Ready to Build Smarter Reports?
At Team Academy, we focus on practical, hands-on learning designed to solve real business challenges.
Learn How To:
✅ Automate Reporting Processes
✅ Master Power Query
✅ Build Professional Dashboards
✅ Create Business KPIs
✅ Deliver Actionable Insights
Join Team Academy and start your journey toward becoming a Power BI professional.
📩 Contact us today to learn more about upcoming Power BI programs and certification pathways.


