


Every powerful dashboard starts with a solid foundation.
This week marked the official launch of Power BI Cohort 153, where participants were introduced to a structured learning journey designed to transform raw business data into meaningful insights and professional dashboards.
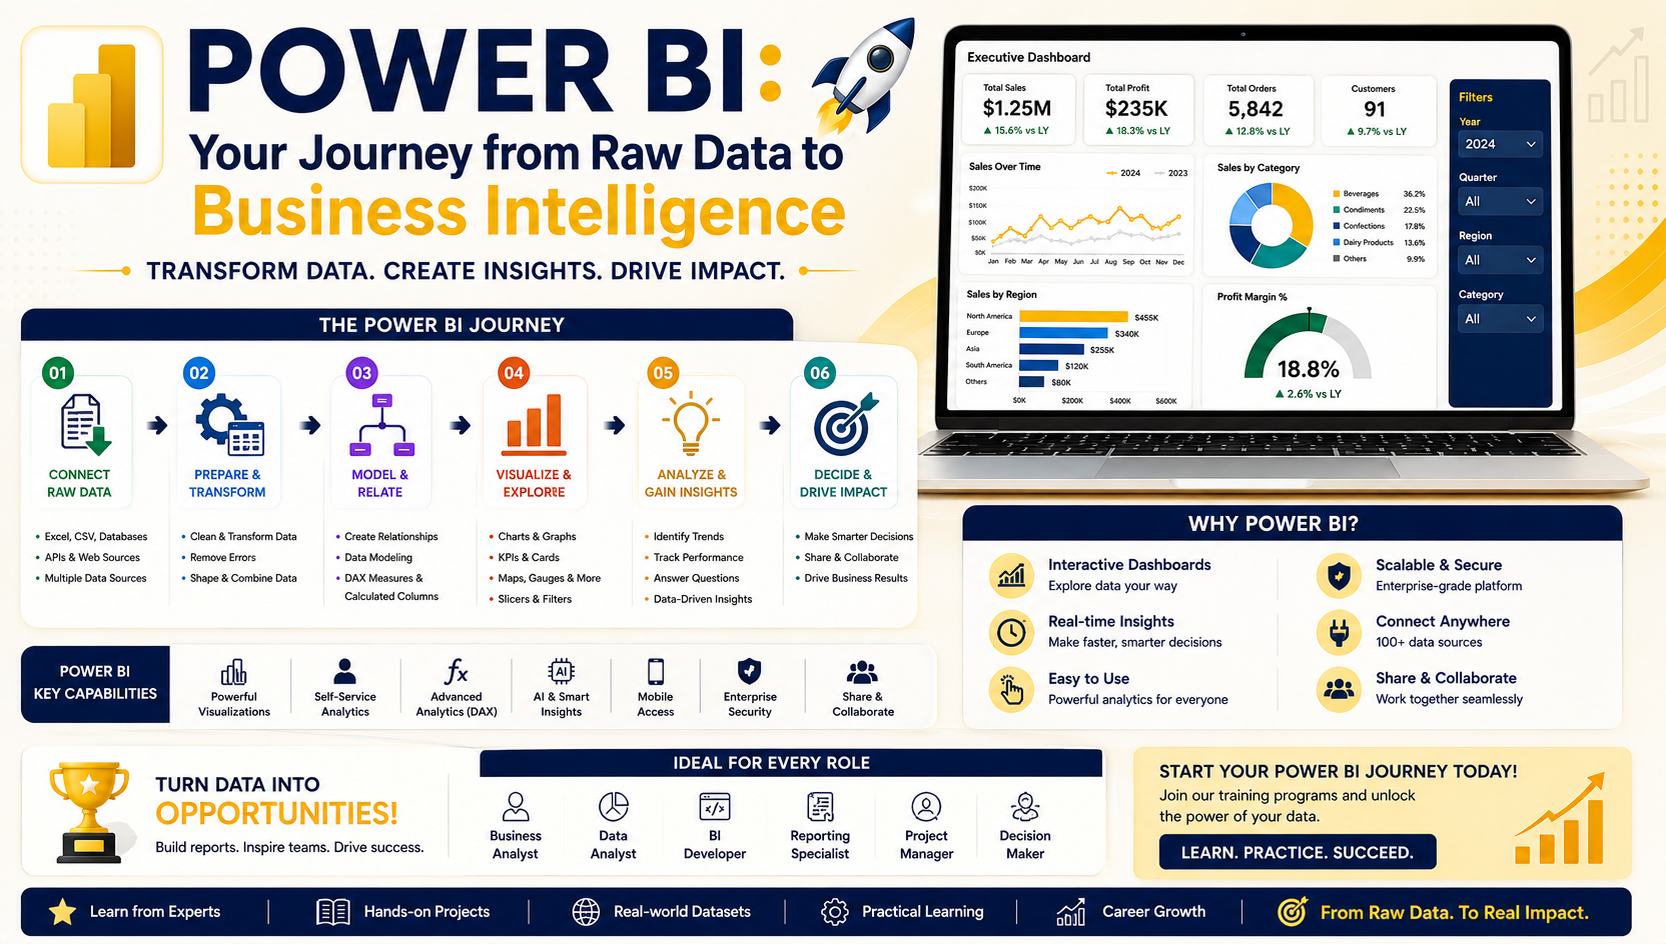
The introductory session provided a roadmap for the upcoming training program, outlining how learners will progress from data preparation to advanced business intelligence reporting using Microsoft Power BI.
📊 What Will Participants Learn?
The training program is designed around four essential pillars of Business Intelligence:
1️⃣ Power Query
Data sourcing, cleansing, transformation, and automation.
2️⃣ Data Modeling
Building relationships between datasets to create scalable reporting models.
3️⃣ DAX & KPI Development
Creating business metrics, calculations, and performance indicators.
4️⃣ Data Visualization
Designing professional dashboards that communicate insights effectively.
By the end of the program, participants will have the skills to create intelligent dashboards capable of supporting real business decisions.
🔍 Why Power Query Matters
The first phase of the training focuses entirely on Power Query, one of the most powerful components of Power BI.
Many organizations struggle with:
❌ Manual Excel reporting
❌ Repetitive VLOOKUP formulas
❌ Data silos across departments
❌ Time-consuming report preparation
Participants learned how Power Query can automate these processes by connecting to multiple data sources and transforming raw data into analysis-ready datasets.
Examples include:
-
Excel Files
-
PDF Reports
-
ERP Systems
-
Databases
-
Online Services
-
Cloud Applications
The goal is to move from manual reporting to real-time business intelligence.
⚡ From Data Chaos to Data Intelligence
A key discussion during the session focused on the challenges businesses face when managing data manually.
Imagine maintaining thousands of spreadsheet formulas every month just to create a single report.
With Power BI and Power Query, these repetitive tasks can be automated, allowing organizations to:
✅ Save Time
✅ Reduce Errors
✅ Improve Accuracy
✅ Generate Real-Time Insights
✅ Increase Productivity
This shift from reactive reporting to proactive intelligence is one of the most valuable outcomes of Business Intelligence implementation.
🏗️ The Power BI Learning Roadmap
The program consists of approximately 13–14 practical sessions, structured to build skills progressively.
Phase 1: Power Query
Data sourcing and transformation.
Phase 2: Data Modeling
Creating relationships and semantic models.
Phase 3: DAX & KPIs
Developing business calculations and performance measures.
Phase 4: Visualization
Designing interactive dashboards and executive reports.
Phase 5: Publishing & Sharing
Delivering reports securely to stakeholders.
Each stage builds upon the previous one, ensuring learners gain a complete understanding of the Power BI ecosystem.
🎯 Learning Through Real Business Scenarios
Unlike theory-based programs, the training focuses heavily on practical implementation.
Participants will work with:
-
Industry datasets
-
Business case studies
-
Real-world reporting scenarios
-
Dashboard development exercises
In addition to class projects, learners will also have the opportunity to develop dashboards based on their own organizational data and business requirements.
📚 Access to Learning Resources
Participants were introduced to the Team Academy Learning Management System (LMS), which provides:
✅ Recorded Sessions
✅ AI-Generated Notes
✅ Practice Datasets
✅ Learning Materials
✅ Dashboard Examples
✅ Additional Exercises
These resources allow learners to continue developing their skills outside of live sessions.
🏆 Program Outcomes
By the end of the training, participants are expected to create:
Dashboard 1
A complete dashboard using the training datasets.
Dashboard 2
A professional dashboard based on their own business scenario or organizational requirements.
These projects will help learners build practical portfolios while applying their newly acquired skills to real business challenges.
📈 Beyond Dashboards: Building Business Value
One of the key messages from the session was that successful dashboards are not judged by appearance alone.
While attractive visualizations are important, the true value lies in:
-
Data accuracy
-
Automation
-
Business intelligence
-
Actionable insights
-
Decision-making support
The objective is not simply to create reports—but to create systems that help organizations make smarter decisions.
🚀 Getting Ready for Success
Participants were advised to prepare for the upcoming classes by:
✔ Installing the latest version of Power BI Desktop
✔ Accessing the LMS portal
✔ Downloading practice datasets
✔ Reviewing learning materials
✔ Identifying business scenarios they would like to model
The next several sessions will focus exclusively on mastering Power Query, providing the foundation for all future Power BI development.
🎯 Ready to Become a Power BI Professional?
At Team Academy, learning goes beyond software training.
Our programs focus on helping professionals:
📊 Master Data Analytics
⚡ Automate Reporting Processes
📈 Create Executive Dashboards
🏗️ Build Scalable Data Models
🚀 Deliver Business Intelligence Solutions
Whether you're an analyst, manager, entrepreneur, or aspiring BI professional, Power BI skills can help transform the way you work with data.
📩 Contact Team Academy and start your journey toward data-driven decision-making today.


