


Power BI learners at Team Academy recently completed an engaging hands-on session focused on one of the most powerful skills in business intelligence — DAX (Data Analysis Expressions).
From creating advanced KPIs to using AI tools like ChatGPT and Claude for generating formulas, this session helped participants move beyond theory and into practical, real-world reporting techniques using the Northwind Traders dataset.
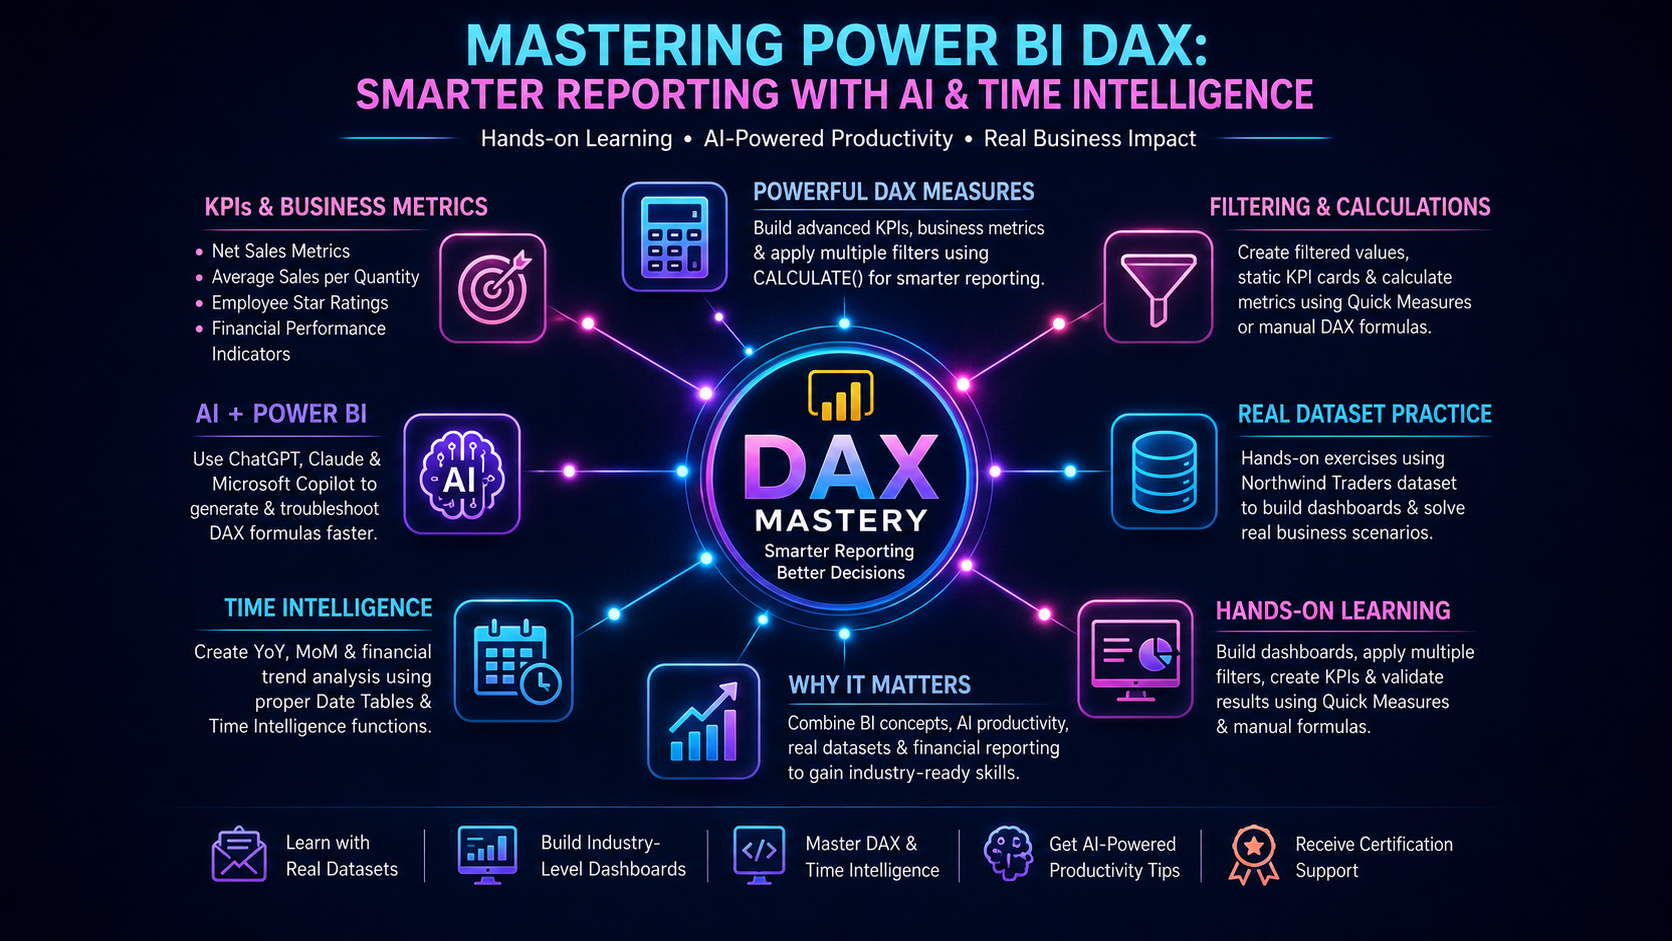
📊 What Participants Learned
✅ Building Powerful DAX Measures
The session focused on practical DAX implementation rather than memorizing formulas. Learners explored how to:
-
Create filtered values for country-specific reporting
-
Build static KPI cards that remain unaffected by slicers
-
Calculate business metrics using both Quick Measures and manual DAX formulas
-
Apply multiple filter conditions using the
CALCULATE()function -
Develop advanced KPIs like:
-
Net Sales Metrics
-
Average Sales per Quantity
-
Employee Star Ratings
-
Financial Performance Indicators
-
Participants also learned the difference between:
-
Power Query → Data transformation
-
DAX → Dynamic calculations and reporting logic
🤖 AI + Power BI = Faster DAX Development
One of the highlights of the session was learning how AI tools can dramatically speed up DAX creation.
The instructor demonstrated how tools like:
-
ChatGPT
-
Claude
-
Microsoft Copilot
can help generate and troubleshoot DAX formulas efficiently when provided with proper business context.
💡 Key takeaway:
AI works best when you clearly explain your tables, relationships, and expected output.
This approach helps learners focus more on solving business problems rather than memorizing syntax.
📈 Time Intelligence Made Simple
The training also covered one of the most requested Power BI skills — Time Intelligence.
Participants learned how to:
-
Connect Date Tables correctly
-
Create:
-
Year-over-Year (YoY) comparisons
-
Month-over-Month (MoM) growth calculations
-
Financial trend analysis measures
-
These techniques are essential for:
✔ Financial dashboards
✔ Sales reporting
✔ Executive KPI tracking
✔ Business forecasting
🌟 Hands-On Learning with Real Business Scenarios
The class included practical exercises where learners:
-
Built interactive dashboards
-
Created employee performance star ratings
-
Applied multiple filter logic
-
Generated business KPIs from scratch
-
Validated results using Quick Measures and manual formulas
One notable exercise involved calculating a KPI for Argentina sales performance using two different DAX approaches — both producing the same accurate result.
🎯 Why This Matters
Modern companies rely heavily on data-driven decisions, and Power BI professionals who understand DAX stand out in the job market.
By combining:
-
Business intelligence concepts
-
AI-assisted productivity
-
Real-world datasets
-
Financial reporting techniques
participants are gaining industry-ready skills that directly apply to analytics and reporting roles.
🚀 Ready to Learn Power BI the Smart Way?
Whether you're preparing for the PL-300 certification, aiming for a data analyst role, or improving your reporting skills for business growth — Team Academy’s practical training approach is designed to help you succeed.
👉 Join Our Upcoming Power BI Sessions
-
Learn with real datasets
-
Build industry-level dashboards
-
Master DAX & Time Intelligence
-
Get AI-powered productivity tips
-
Receive certification support
📩 Contact Team Academy today to reserve your seat in the next batch!


